We concluded that T2-weighted imaging (T2WI) was useful for differential diagnosis between lung cancer and PNMs.
Usuda K, et al. Novel Insights of T2-Weighted Imaging: Significance for Discriminating Lung Cancer from Benign Pulmonary Nodules and Masses. Cancers 2021; 13(15): 3713, doi: 10.3390/cancers13153713
Abstract: Diffusion-weighted imaging is useful for discriminating lung cancer from benign pulmonary nodules and masses (BPNMs), however the diagnostic capability is not perfect. The aim of this research was to clarify whether T2-weighted imaging (T2WI) is efficient in discriminating lung cancer from BPNMs, especially from pulmonary abscesses. A T2 contrast ratio (T2 CR) for a pulmonary nodule is defined as the ratio of T2 signal intensity of a pulmonary nodule divided by the T2 signal intensity of the rhomboid muscle. There were 52 lung cancers and 40 inflammatory BPNMs (mycobacteria disease 12, pneumonia 13, pulmonary abscess 9, other 6) and seven non-inflammatory BPNMs. The T2 CR (2.14 ± 0.63) of lung cancers was significantly lower than that (2.68 ± 1.04) of BPNMs (p = 0.0021). The T2 CR of lung cancers was significantly lower than that (2.93 ± 0.26) of pulmonary abscesses (p = 0.011). When the optical cutoff value of T2 CR was set as 2.44, the sensitivity was 0.827 (43/52), the specificity 0.596 (28/47), the accuracy 0.717 (71/99), the positive predictive value 0.694 (43/62), and the negative predictive value 0.757 (28/37). T2 CR of T2WI is useful in discriminating lung cancer from BPNMs. Pulmonary abscesses, which show strong restricted diffusion in DWI, can be differentiated from lung cancers using T2WI.
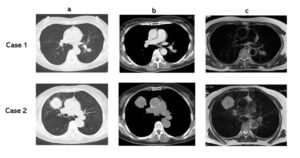 Fig. 42 a: CT, b: CT, c: T2 WI Case 1: Adenocarcinoma, T2 CR: 2.03 Case 2: Squamous cell carcinoma T2 CR: 2.43
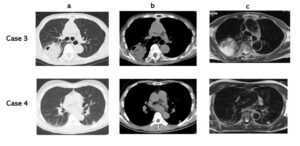 Fig. 43 a: CT, b: CT, c: T2 WI Case 3: Non-tuberculous mycobacteria. T2 CR: 3.52 Case 4: Hamartoma. T2 CR: 2.95
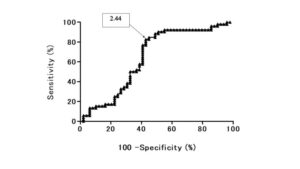 Fig. 44 Receiver operating characteristic (ROC) analysis shows the diagnostic performance of T2 CR for distinguishing benign pulmonary nodule and mass (BPNM) from lung cancer. Area under the ROC curve (AUC) was 64.8% and the 95% confidence interval was 54.0% to 76.4%. T2 CR =2.44, sensitivity 0.827 (43/52), specificity 0.596 (28/47), accuracy 0.717 (71/99), PPV 0.694 (43/62), and NPV 0.757 (28/37).
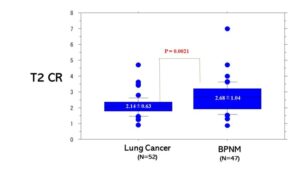 Fig. 45 T2 Contrast ratio (CR) between lung cancer and BPNM. T2 CR was the ratio of T2 signal intensity of the pulmonary nodule divided by T2 signal intensity of rhomboid muscle. T2 CR (2.14±0.63) of lung cancer was significantly lower than that (2.68±1.04) of BPNMs (P=0.0021).
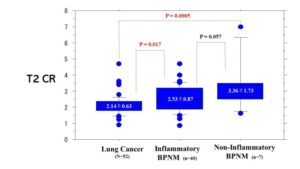 Fig. 46 T2 Contrast ratio (CR) among lung cancers, inflammatory BPNMs and non-inflammatory MPNMs. T2 CR (2.14±0.63) of lung cancers was significantly lower than that (2.53±0.87) of inflammatory BPNMs (P=0.011) and significantly lower than that (3.36±1.73) of non-inflammatory BPNMs (P=0.0005).
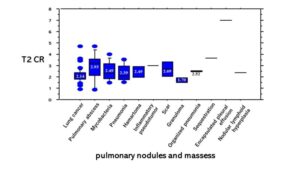 Fig. 47 T2 WIs based on each diagnosis of PNMs. The T2 CR (2.14±0.63) of lung cancer was significantly lower than that (2.93±1.26) of pulmonary abscesses (P=0.0069) and not significantly lower than that (2.49±0.80) of mycobacteria infections (P=0.11).
