
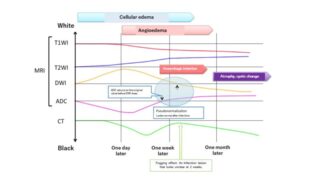


We reported that MRI of diffusion-weighted imaging and T2-weighted imaging is superior than FDG-PET/CT for differential diagnosis between lung cancer and benign pulmonary nodules and masses (Fig. 48~ 59).
Usuda K, et al. Pulmonary Nodule and Mass: Superiority of MRI of Diffusion-Weighted Imaging and T2-Weighted Imaging to FDG-PET/CT. Cancers 2021, 13 (20), 5166; https://doi.org/10.3390/cancers13205166
Abstract: The purpose of this retrospective study was to compare the diagnostic efficacy of FDG-PET/CT and MRI in discriminating malignant from benign pulmonary nodules and masses (PNMs). There were 278 lung cancers and 50 benign PNMs that were examined by FDG-PET/CT and MRI. The T2 contrast ratio (T2 CR) was designated as the ratio of T2 signal intensity of PNM divided by T2 signal intensity of the rhomboid muscle. The optimal cut-off values (OCVs) for differential diagnosis were 3.605 for maximum standardized uptake value (SUVmax), 1.459 × 10⁻³ mm2/s for apparent diffusion coefficient (ADC), and 2.46 for T2 CR. Areas under the receiver operating characteristics curves were 67.5% for SUVmax, 74.3% for ADC, and 72.4% for T2 CR, respectively. The sensitivity (0.658) of SUVmax was significantly lower than that (0.838) of ADC (p < 0.001) and that (0.871) of T2 CR (p < 0.001). The specificity (0.620) of SUVmax was that the same as (0.640) ADC and (0.640) of T2 CR. The accuracy (0.652) of SUVmax was significantly lower than that (0.808) of ADC (p < 0.001) and that (0.835) of T2 CR (p < 0.001). The sensitivity and accuracy of DWI and T2WI in MRI were significantly higher than those of FDG-PET/CT. Ultimately, MRI can replace FDG PET/CT for differential diagnosis of PNMs saving healthcare systems money while not sacrificing the quality of care.
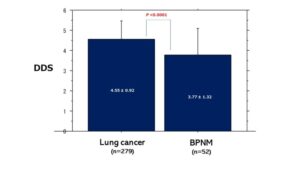 Fig. 48 Comparison of DDS score between lung cancer and BPNM. Mean DDS (4.55 ± 0.92) of lung cancer was significantly higher than that (3.77 ± 1.32) of BPNM (p < 0.0001).
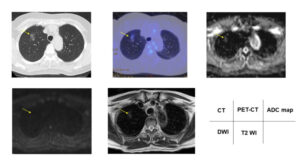 Fig. 49 Papillary adenocarcinoma showed 1.90 of SUVmax, DDS 1, 1.85 × 10⁻³ mm2/s of ADC and 1.97 of T2 CR. The yellow arrows indicate an adenocarcinoma.
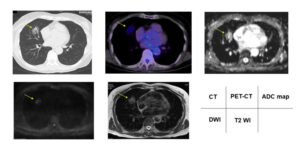 Fig. 50 Acinar adenocarcinoma showed 2.17 of SUVmax, DDS 2, 1.67 × 10⁻³ mm2/s of ADC and 1.34 of T2 CR. The yellow arrows indicate an acinar adenocarcinoma.
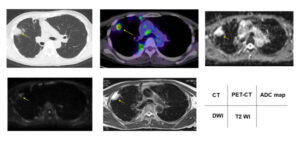 Fig. 51 Nontuberculous mycobacteria showed 5.00 of SUVmax, DDS 3, 2.50 × 10⁻³ mm2/s of ADC and 4.00 of T2 CR. The yellow arrows indicate a nontuberculous mycobacteria.
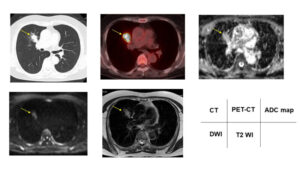 Fig. 52 Pneumonia showed 15.0 of SUVmax, DDS 4, 1.62 × 10⁻³ mm2/s of ADC and 3.33 of T2 CR. The yellow arrows indicate a pneumonia.
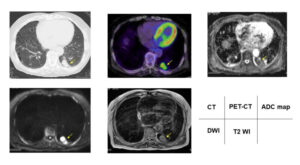 Fig. 53 Papillary adenocarcinoma showed 7.7 of SUVmax, DDS 5, 1.20 × 10⁻³ mm2/s of ADC and 1.98 of T2 CR. The yellow arrows indicate an papillary adenocarcinoma.
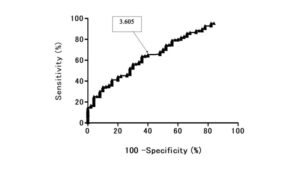 Fig. 54 Receiver operating characteristic (ROC) curve shows the diagnostic performance of SUVmax for distinguishing benign pulmonary nodule and mass (BPNM) from lung cancer. Area under the ROC curve 67.5%. SUV max=3.605, sensitivity 65.25%, specificity 60.0%, accuracy 64.3 %.
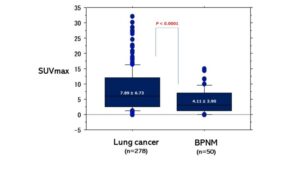 Fig. 55 Relationships between SUVmax and lung cancer / BPNM The mean SUVmax (7.89 ± 6.73) of lung cancer was significantly higher than that (4.11 ± 3.90) of BPNM (p < 0.0001)
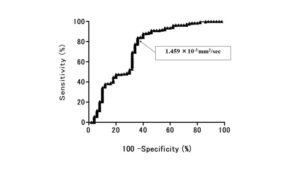 Fig. 56 Receiver operating characteristic (ROC) curve shows the diagnostic performance of ADC for distinguishing benign pulmonary nodule and mass (BPNM) from lung cancer. Area under the ROC curve 74.3 %. ADC=1.459 ×10⁻³ mm2/sec , sensitivity 84.0 %, specificity 64.0 %, accuracy 81.1%
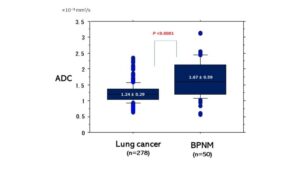 Fig. 57 Relationships between mean ADC and lung cancer / BPNM The mean ADC (1.24 ± 0.29 ×10⁻³ mm2/sec) of lung cancer was significantly lower than that (1.67 ± 0.59 ×10⁻³ mm2/sec) of BPNM (p < 0.0001).
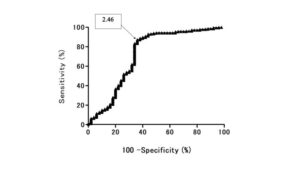 Fig. 58 Receiver operating characteristic (ROC) curve shows the diagnostic performance of T2 CR for distinguishing benign pulmonary nodule and mass (BPNM) from lung cancer. Area under the ROC curve 72.4%. T2 CR =2.46, sensitivity 87.3%, specificity 64.0 %, the accuracy 83.8 %.
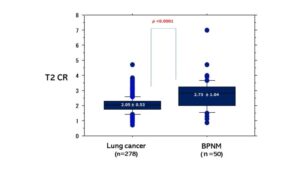 Fig. 59 Relationships between mean T2 CR and lung cancer / BPNM The mean T2 CR (2.05 ± 0.53) of lung cancer was significantly lower than that (2.73 ± 1.04) of BPNM (p < 0.0001).