


We proved that the combined assessment of DWI and T2WI (①), inside/wall ADC ratio (②)and whole-lesion ADC histogram (③) could be useful for differential diagnosis between lung cancer and BPNMs.
The first method①: the combined assessment of DWI and T2-weighted imaging (T2WI) Not only DWI but also T2WI are useful for differential diagnosis of PNMs. The combined assessment of DWI and T2WI of PNMs could judge PNMs more precisely and would be acceptable for differential diagnosis of PNMs.
The second method②: Although ADC of DWI could differentiate lung cancer from BPNM, the inside/wall ADC ratio of DWI (which is the inside ADC divided by the wall ADC of the lesion) could be efficient for differentiation between lung cancer and lung abscess. The inside/wall ADC ratio of DWI strengthens a weak point of DWI.
The third method③: Whole-lesion ADC histogram has potential to be a valuable tool to differentiate pulmonary abscesses and mycobacterial infections (PAMIs) from lung cancer.
A. The first method ①: DWI & T2-weighted imaging (T2WI) (Fig. 30-32)
Usuda K, et al. Combination Assessment of Diffusion-Weighted Imaging and T2-Weighted Imaging Is Acceptable for the Differential Diagnosis of Lung Cancer from Benign Pulmonary Nodules and Masses. Cancers 2021, 13, 1551. https://doi.org/10.3390/cancers13071551
Abstract: The purpose of this study is to determine whether combining DWI and T2-weighted imaging (T2WI) improves the diagnostic ability for differential diagnosis of lung cancer from benign pulmonary nodules and masses (BPNMs). The optimal cut-off value (OCV) for differential diagnosis was set at 1.470 × 10⁻³ mm2/s for apparent diffusion coefficient (ADC), and at 2.45 for T2 contrast ratio (T2 CR). The ADC (1.24 ± 0.29 × 10⁻³ mm2/s) of lung cancer was significantly lower than that (1.69 ± 0.58 × 10⁻³ mm2/s) of BPNM. The T2 CR (2.01 ± 0.52) of lung cancer was significantly lower than that (2.74 ± 1.02) of BPNM. As using the OCV for ADC, the sensitivity was 83.9% (220/262), the specificity 63.4% (33/52), and the accuracy 80.6% (253/314). As using the OCV for T2 CR, the sensitivity was 89.7% (235/262), the specificity 61.5% (32/52), and the accuracy 85.0% (267/314). In 212 PNMs which were judged to be malignant by both DWI and T2WI, 203 PNMs (95.8%) were lung cancers. In 33 PNMs which were judged to be benign by both DWI and T2WI, 23 PNMs (69.7%) were BPNMs. Using DWI and T2WI in combination could judge PNMs more precisely and would be acceptable for differential diagnosis of PNMs.
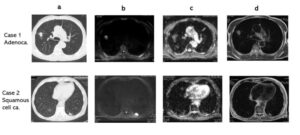
Fig. 30 a: CT, b: DWI, c: ADC map, d: T2 WI
Case 1: Adenocarcinoma, ADC 1.39×10⁻³ mm2/sec, T2 CR: 1.67
Case 2: Squamous cell carcinoma ADC 1.04×10⁻³ mm2/sec,
T2 CR: 1.25
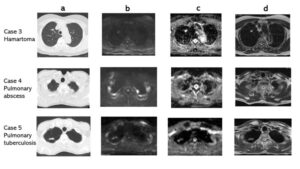
Fig.31 a: CT, b: DWI c: ADC map, d: T2 WI
Case 3: Hamartoma, ADC 2.43×10⁻³ mm2/sec, T2 CR: 3.61
Case 4: Pulmonary abscess ADC 0.837×10⁻³ mm2/sec, T2 CR: 3.64
Case 5: Pulmonary tuberculosis ADC 1.85×10⁻³ mm2/sec, T2 CR:1.87
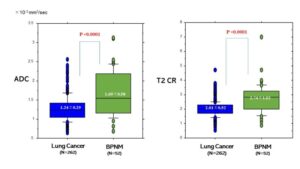 Fig. 32 ADC and T2 Contrast ratio (CR) between lung cancer and BPNM. The ADC (1.24±0.29 x 10⁻³mm2/sec) of lung cancer was significantly lower than that (1.69±0.58 x 10⁻³mm2/sec) of BPNM (P<0.0001). T2 CR was the ratio of T2 signal intensity of the pulmonary nodule divided by T2 signal intensity of rhomboid muscle. The T2 CR (2.01±1.02) of lung cancer was significantly lower than that (2.74±1.02) of BPNM (P<0.0001).
B: The second method②: ADC & inside/wall ADC ratio in DWI (Fig. 33~37)
Usuda K, et al. How to Discriminate Lung Cancer from Benign Pulmonary Nodules and Masses? Usefulness of Diffusion-Weighted Magnetic Resonance Imaging with ADC and Inside/Wall ADC Ratio. Clinical Medicine Insights: Oncology 2021,15: 1-9. https://doi.org/10.1177/11795549211014863
Abstract: Although diffusion-weighted imaging (DWI) is useful for differential diagnosis between lung cancers and benign pulmonary nodules and masses (BPNMs), it is difficult to differentiate pulmonary abscesses from lung cancers because pulmonary abscesses show restricted diffusion, which means the fluid in the abscesses is highly viscus and makes it difficult for DWI to get an accurate reading. With this research we will present how to assess the total apparent diffusion coefficient (ADC) and inside/wall ADC ratio for these pulmonary nodules and masses (PNMs).
The pulmonary lesions were divided into 3 groups. There were 40 lung cancers, 41 inflammatory benign PNMs [Mycobacteria disease 13, pneumonia 12, pulmonary abscess 10, other 6] and 7 non-inflammatory benign PNMs. Definitions were as follows: wall ADC = ADC value in outer one third of the lesion; inside ADC = ADC value in central two thirds of the lesion: inside/wall ADC ratio = ratio of inside ADC / wall ADC. Mean total ADC (1.26±0.32 x 10⁻³mm2/sec) of the lung cancers was remarkably lower than that (1.53±0.53) of the BPNMs. The mean total ADC values were 1.26±0.32 in lung cancer, 1.45±0.47 in inflammatory BPNM and 2.04±0.63 in non-inflammatory BPNM, and there were significant differences among them. The mean inside ADC value (1.33±0.32) of the lung cancers was remarkably higher than that (0.94±0.42) of the pulmonary abscesses. The mean inside/wall ADC ratio (1.20±0.28) of the lung cancers was remarkably higher than that (0.74±0.14) of the pulmonary abscesses. Although ADC of DWI could differentiate lung cancer from BPNM, the inside/wall ADC ratio of DWI is efficient for differentiation between lung cancer and lung abscess. The inside/wall ADC ratio of DWI strengthens a weak point of DWI.
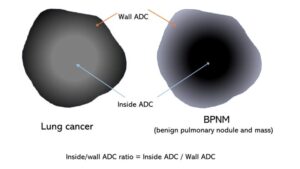 Fig. 33 Schemas of ADC map for lung cancer and BPNM. Wall ADC was defined as the ADC value measured in the outer one third of the lesion. Inside ADC was defined as the ADC value measured in the central two thirds of the lesion. Inside/wall ADC ratio was the ratio of inside ADC divided by the wall ADC.
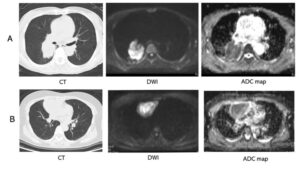 Fig. 34 A: Adenocarcinoma. Total ADC value: 1.21 x 10⁻³mm2/sec. Wall ADC: 1.18 x 10⁻³mm2/sec. Inside ADC: 1.25 x 10⁻³mm2/sec. Wall / Inside ADC ratio 1.11
B: Pulmonary abscess. Total ADC : 1.40 x 10⁻³mm2/sec. Wall ADC: 2.00 x 10⁻³mm2/sec. Inside ADC: 1.13 x 10⁻³mm2/sec. Inside / Wall ADC ratio 0.57
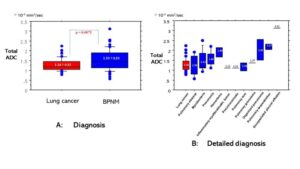 Fig. 35 Total ADC value based on lung cancer or benign pulmonary nodule and mass (BPNM)
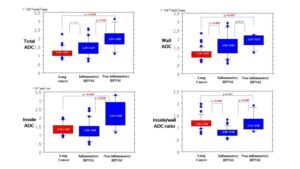 Fig. 36 Total ADC, wall ADC, inside ADC, inside/ wall ADC ratio based on lung cancer, inflammatory or non-inflammatory BPNM.
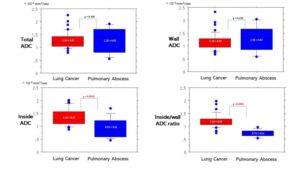 Fig. 37 Total ADC, wall ADC, inside ADC, inside/wall ADC ratio based on lung cancer or pulmonary abscess
C. The third method③: Whole-lesion ADC Histogram in DWI (Fig. 38~41)
Usuda K, et al. Whole-lesion Apparent Diffusion Coefficient Histogram analysis: Significance for Discriminating Lung Cancer from Pulmonary Abscess and Mycobacterial Infection. Cancers 2021; 13(11): 2720; https://doi.org/10.3390/cancers13112720
Abstract: Diffusion-weighted magnetic resonance imaging (DWI) can differentiate malignant from benign pulmonary nodules. But it is difficult to differentiate pulmonary abscesses and mycobacterial infections (PAMIs) from lung cancers because PAMIs show restricted diffusion in DWI. The purpose of this study is to establish the role of ADC histogram for differentiating lung cancer from PAMI. There were 41 lung cancers (25 adenocarcinomas, 16 squamous cell carcinomas), and 19 PAMIs (9 pulmonary abscesses, 10 mycobacterial infections). A newly developed medical imaging software, BD score (PixSpace, Fukuoka, Japan) was used for the analysis of ADC histograms. Several parameters exceed more than 60% of the area under the ROC curve (AUC) were ADC, maximal ADC, mean ADC, median ADC, most frequency ADC, kurtosis of ADC and volume of lesion. There were significant differences between lung cancer and PAMI in ADC, mean ADC, median ADC and most frequency ADC. The ADC (1.19 ± 0.29 x 10⁻³mm2/sec) of lung cancer obtained from a single slice was significantly lower than that (1.44 ± 0.54) of PAMI (p=0.0262). In contrast, mean, median or most frequency ADC of lung cancer which was obtained in the ADC histogram was significantly higher than the value of each parameter of PAMI. ADC histogram could discriminate PAMIs from lung cancers by showing that AUCs of several parameters were more than 60%, and that several parameters of ADC of PAMI were significantly lower than those of lung cancer. ADC histogram has potential to be a valuable tool to differentiate PAMI from lung cancer.
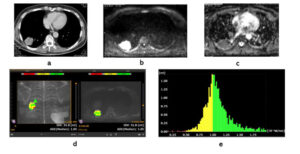 Fig. 38 Adenocarcinoma: CT (a), DWI (b), ADCmap (c), BD score view (d) and ADC histogram (e) were presented. ADC on single slice : 0.96 x 10⁻³mm2/sec, minimum ADC: 0.16 x 10⁻³mm2/sec, maximum ADC: 1.99 x 10⁻³mm2/sec, mean ADC : 1.09 x 10⁻³mm2/sec, median ADC: 1.05 x 10⁻³mm2/sec, standard division of ADC: 0.24 x 10⁻³mm2/sec, most frequency ADC : 0.97 x 10⁻³mm2/sec, kurtosis of ADC: 4.84, skewness of ADC : 0.924, volume of lesion: 31.7 ml
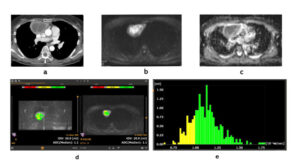 Fig.39 Pulmonary abscess: CT(a), DWI(B), ADC map (C), BD score view(D) and ADC histogram (E)) were presented. ADC on single slice : 1.14 x 10⁻³mm2/sec, minimum ADC: 0.64 x 10⁻³mm2/sec, maximum ADC: 2.80 x 10⁻³mm2/sec, mean ADC : 1.46 x 10⁻³mm2/sec, median ADC: 1.43 x 10⁻³mm2/sec, standard division of ADC: 0.37 x 10⁻³mm2/sec, most frequency ADC : 1.12 x 10⁻³mm2/sec, kurtosis of ADC: 4.37, skewness of ADC : 0.73, volume of lesion: 65.2 ml
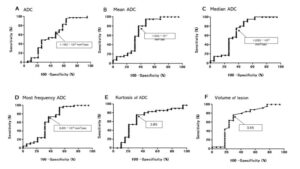 Fig. 40 Receiver operating characteristic (ROC) curves of six important parameters that showed the largest area under the curves (AUCs) for differential diagnosis for lung cancer and pulmonary abscess and mycobacterial infections(PAMI). A: ADC, B: Mean ADC, C: Median ADC, D: Most frequency ADC, E: Kurtosis of ADC, F: Volume of lesion
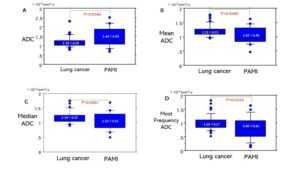 Fig. 41 Box-and-whisker plots of four important parameters which had a significant difference between lung cancer and pulmonary abscess and mycobacterial infections (PAMI). A: ADC, B: Mean ADC, C: median ADC, D: Most frequency ADC